confidence interval
scroll ↓ to Resources
Contents
Note
- confidence level
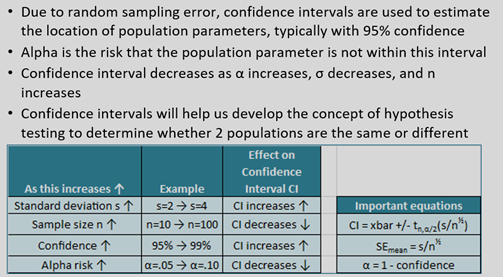
- alpha risk = 1 - confidence level, the risk that population parameter (e.g. mean) is not within the CI
- confidence LEVEL up ⇒ WIDER confidence interval ⇒ less practicall value
- confidence level 68% ⇒ t-stats ~= 1 (from the T-table)
- confidence level 95% ⇒ t-stats ~= 2
- confidence level 99% ⇒ t-stats ~= 3
- CI(mu) = sample mean +- MOE = sample mean +- Tstats * SEmean
- CI = 2*MOE
- Sample size n
o sample size n up ⇒ narrower confidence interval (by sqrt(n))
o at n = 25, reduction of 80% of CI is achieved
o if n<30, sample mean is a student-distribution and t-stats needs to be defined from the Z-table 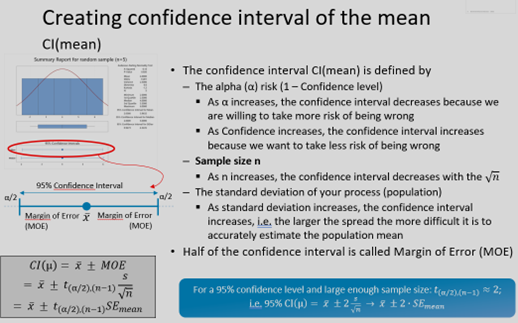
Misconceptions
- “I am 95% confident that the population mean is the sample mean”
- “95% of the data are between lower and upper bound”
- Correct: The CI is not based on raw data, It is based on descriptive statistics of the sample data.
- “I am 95% confident that the population mean is within the CI in my dataset”
- Correct: 95% of confidence intervals in repeated experiments will contain the true population mean. CI is not about the population parameter, but the confidence of the sample mean estimation.
- “Confidence intervals for two parameters overlap, therefore they cannot be significantly different.”
- Correct: The CI doesnt tell anything about the relationship between parameters only refers to the estimate of a parameter.
Resources
- karpov courses
- Design for Six Sigma
- thesaurus
- Master statistics & machine learning: intuition, math, code
Links to this File
table file.inlinks, filter(file.outlinks, (x) => !contains(string(x), ".jpg") AND !contains(string(x), ".pdf") AND !contains(string(x), ".png")) as "Outlinks" from [[]] and !outgoing([[]]) AND -"Changelog"